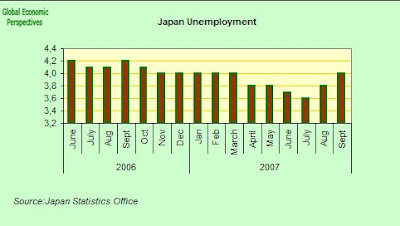
The Bank of Japan had been expecting demand for workers to drive up pay, fueling an expansion in consumer spending. However the Labor Ministry has now downgraded its assessment of the job market, admitting that the improvement in hiring "has weakened in recent months.'' As we can see in the chart below the number of people actually stepping up to the plate looking for work (the active labour force) has eased off since the summer, but the number actually employed has eased off even more. What we need to now look at in more detail is the September monthly labour survey, since this enables us to see the proportion between part time and full time work, and the relation between "regular" and "non regular" employees in the total employed labour force (the category of "non-regular contract" employees is something which has grown considerably in importance since the labour market reforms of the late 1990s). A lot of the explanation for the very weak Japanese earnings data - wages it should be remembered have fallen continuously in the first seven months of 2007 and have now fallen 10 percent over the past decade - is a by-product of the steadily growing importance of "non regular" and part-time work in the Japanese economy in recent years and this is, in part, a reflection of the steady ageing of the Japanese labour force.

The number of jobs available for each applicant also slipped for a third month to 1.05 in September from 1.06 in August according to the Labor Ministry. The pace of hiring is slowing as well. In September the number of people hired increased by 130,000 and this compares with an increase 590,000 in August. Staff at companies with fewer than 30 employees fell by 2.1 percent, the first decline in four months.
If we come to look at the relation between part time and full time workers we can see that part-time regular employees have increased in number steadily since the middle of 2006, but that the total turned down in September 2007, we will now need to watch these numbers carefully to see if this is simply a "blip" or represents the start of a trend.

Coming to full time regular workers, what stands out most in the chart is the significant increase which took place in April, presumeably becuase a significant number of part time or non-regular workers received regular full time contracts. Since this time the number has more or less held constant.

So it is in the area of non-regular workers, as might be expected, that most of the movement and the action seems to be taking place. Looking at the chart we can see that the number of these workers increased by 1.5 million between January and May, but that since this time the number of these workers have been steadily falling. Could the volume of this employment constitute something of a leading index for movements in the Japanese economy. Something is evidently happening. When we get the Q3 2007 data we will undoubtedly find out what.


